The paradox is that
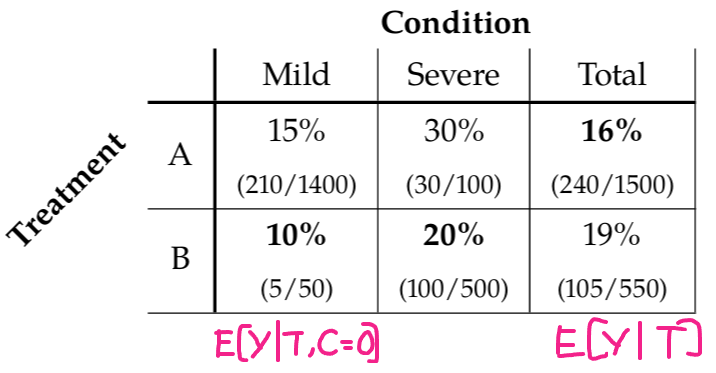
- treatment $B$ looks better in both of the subgroups,
- but treatment $A$ looks better when examining the total population ignoring the subgroups.
New disease: COVID-27
Currently receiving treatment $A$ vs. $B$: 73% / 27%
Goal: Choosing which treatment to use.
The paradox is that
$$ \frac{50}{550} (0.10) + \frac{500}{550} (0.20) = 0.19 $$
The non-uniformity of allocation of people to the groups:
people with mild condition are less likely to die $\Rightarrow$ total mortality rate for those with treatment A is lower.
Doctors give treatment $A$ to most people with mild conditions, save the more expensive and limited treatment $B$ for ppl with severe conditions.
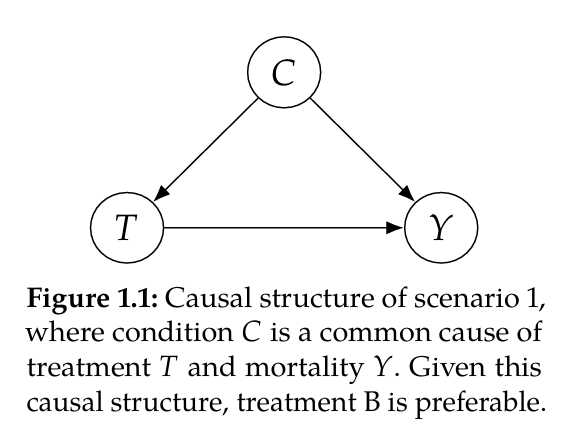
$C$ confounds $T$. To correct for this confounding, examine the relationship of $T$ and $Y$ among patients with the same conditions $\Rightarrow$ consider subpopulations (“Mild” and “Severe” columns).
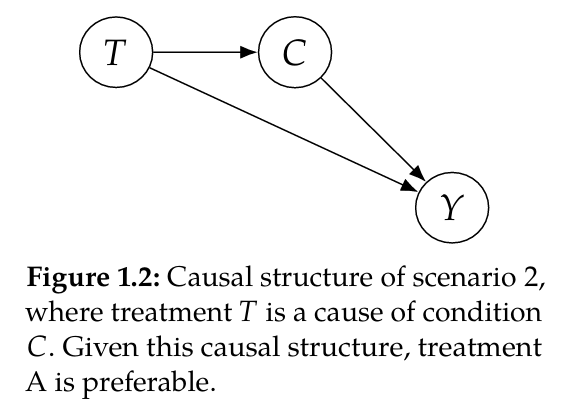
Might have to wait a long time to take treatment $B$ (its scarce). In that time, the condition got worsen (mild $\to$ severe).
$\Rightarrow$ Treatment $B$ is a cause of the Condition.
Even if treatment B
$\Rightarrow$ $B$ is less effective in total.
correlation: measures linear relationships.
association: any kind of statistical dependence.
Just because two things are associated doesn’t mean one causes the other. The relationship could be partly causal, fully causal, or not causal at all.
Example - Shoes and Headaches Data might show that people who sleep with shoes on often wake up with headaches. Sleep with shoes on $\to$ wake up with headaches? Actually, both events are often caused by a third factor: drinking alcohol the night before.